
Plot File Description
A plot file is generated by default at the conclusion of every execution and otherwise when requested in the Output Control Card with the Plot File Output Times input items. If a file named plot.n (where n refers to the time step extension) already exists in the current directory, then the file will be erased and overwritten. The user is responsible for renaming previous plot.n files prior to executing the simulator. Examples of post-processing of the plot.n files are provided on the Plot File Post-processing page.
Header
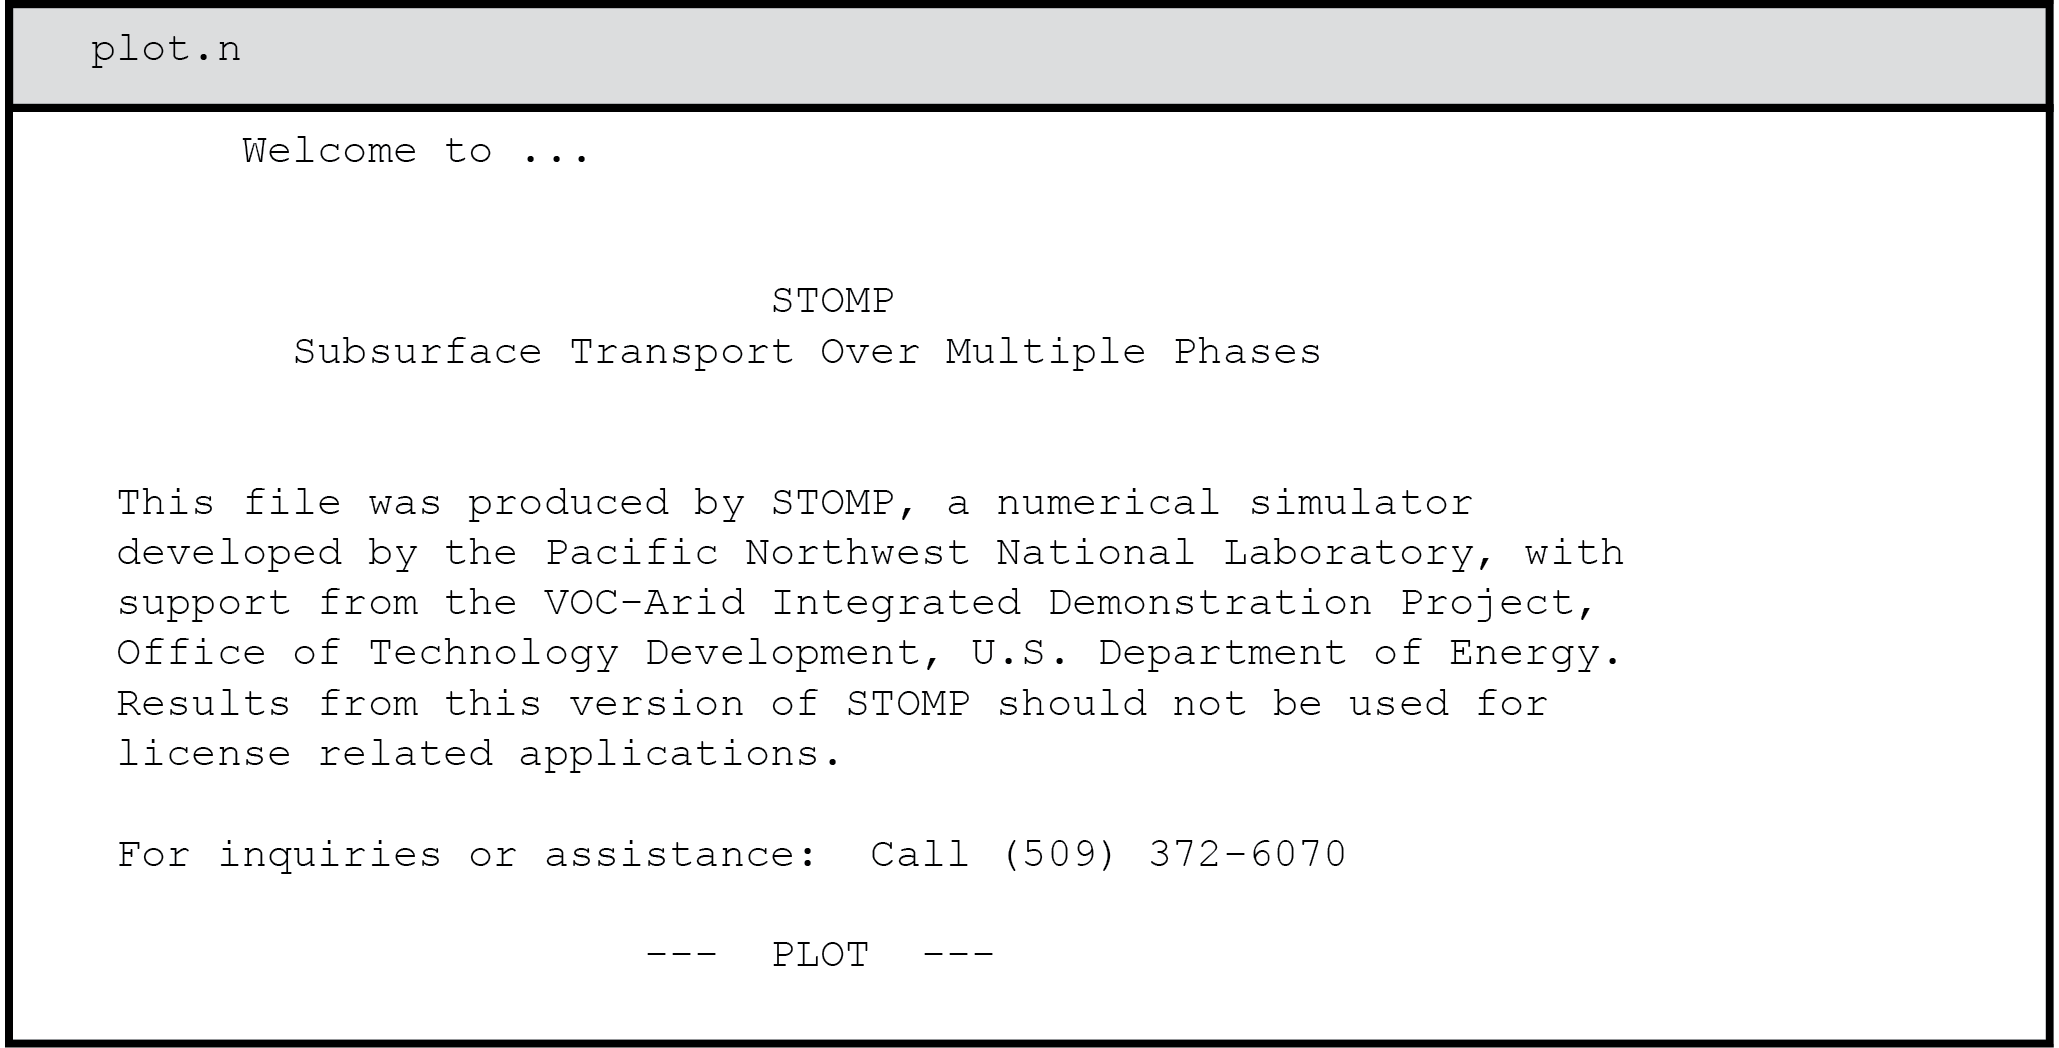
A plot file begins with a welcome statement, disclaimer, and banner, which should appear similar to:
Data
Following this header are data for the current time step (1), simulation time (2), number of nodes in the three coordinate directions (3), followed by the number of active nodes (4) and the number of vertices defining each node (5). The next set of information describes the grid by specifying the x- or radial-direction nodal vertices locations (6), the y- or azimuthal-direction nodal vertices locations (7), the z-direction nodal vertices locations (8), and the node volume (9) for every node in the computational domain. Following this information is a node map (10).
The remaining portion of a plot.n file comprises arrays of variable data that correspond to the requested Plot File Variables. Field variable data groups list the value of the field variable at the node centroid. Fluxes in the plot file should be requested using the node centroid (nc) variable name (ie., xnc aqueous volumetric flux). Node centroid values for flux variables are simple arithmetic averages of the two nodal surface values. These field variable data are arranged in groups, each with a title line that indicates the type of data (11). Each group of data contains a field variable listed sequentially for every node in the computational domain (12). Data groups are arranged in rows with 10 data items per row.
