
Black-Oil Properties Options (EOR-BO)
The Black-Oil Properties Card is the mechanism by which PVT information about the oil and gas are entered into the code for STOMP-EOR-BO. Inputs are required for the bubble-point model, oil formation volume fraction model, oil viscosity model, gas Z factor model, and gas viscosity model in specified function forms. Curve fitting capabilities are not currently included in STOMP-EOR-BO for these functional forms, so the input parameters and model coefficients need to be determined independently.
Bubble Point Model
The gas-to-oil ratio versus bubble-point pressure function used the form of Al-Shammasi[1]
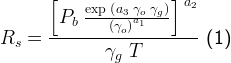
with gas-to-oil ratio in Mscf/stb, temperature in ˚F, and pressure in psia. The three parameters in Equation (1) were determined from a least-squares fit to the Farnsworth oil, as shown in Figure 1.

Figure 1. Gas-to-oil ratio versus bubble-point pressure Farnsworth data and function fit.
Oil Viscosity Model
The nonaqueous-liquid viscosity is computed via a series of functions. Under two-phase conditions (i.e., nonaqueous-liquid and gas), the pressure is at the bubble-point and the bubble-point viscosity model of Elsharkawy and Alikhan (1999) is used, which depends on the dead-oil viscosity:

with viscosity in cP, and pressure in psia. When the pressure is above the bubble-point, nonaqueous-liquid conditions exist, and the under-saturated oil viscosity model of Elsharkawy and Alikhan (1999) is used, which depends on the dead-oil viscosity:
The dead-oil viscosity is determined from the model of Elsharkawy and Alikhan (1999):


Figure 2. Nonaqueous-liquid viscosity versus pressure Farnsworth data and function fit.
Oil FVF Model
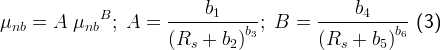
The nonaqueous-liquid formation volume fraction is computed via a series of functions. Under two-phase conditions (i.e., nonaqueous-liquid and gas), the pressure is at the bubble-point and the form of Al-Shammasi (2001) is used, which requires four fitting parameters:

with formation volume factor in bbl/STB, temperature in ˚F, gas-to-oil ratio in scf/STB. When the pressure is above the bubble-point, nonaqueous-liquid conditions exist, and the under-saturated oil formation volume factor is computed via the formulation of Lasater (1958), which requires the isothermal compressibility:

with formation volume factor in bbl/STB and pressure in psia. Isothermal compressibility of the nonaqueous-liquid is computed using the formulation of Farshad (1996):
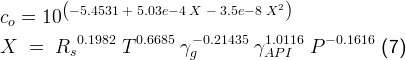

Figure 3. Nonaqueous-liquid formation-volume-factor versus pressure Farnsworth data and function fit.
Nonaqueous-liquid density is computed using a petroleum industry standard form as a function of the gas-to-oil volume ratio and the nonaqueous-liquid formation volume factor:

The oil specific gravity is determined from the API gravity:

Gas Z-Factor Model
The gas compressibility factor versus pressure is expressed using a five-parameter polynomial form:

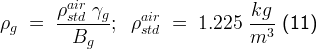

Figure 4. Gas compressibility factor versus pressure Farnsworth data and function fit.
The gas formation volume factor is computed from the gas compressibility factor, temperature and pressure:
where the form uses pressure in Pa and temperature in ˚K.
Gas Viscosity Model
The gas viscosity versus gas density polynomial has more simple form and only requires three parameters:

with gas viscosity in Pa s and gas density in kg/m3. The three parameters in Equation (13) were determined from a least-squares fit to the Farnsworth oil, as shown in Figure 5.

Figure 5. Gas viscosity versus gas density Farnsworth data and function fit.
References
[1] Al-Shammasi, A.A. 2001. A Review of Bubblepoint Pressure and Oil Formation Volume Factor Correlations. SPE Res Eval & Eng 4 (2): 146-160. SPE-71302-PA. http://dx.doi.org/10.2118/71302-PA.
[2] Elsharkawy, A.M. and Alikhan, A.A. 1999. Models for predicting the viscosity of Middle East crude oils. Fuel 78 (8): 891–903. http://dx.doi.org/10.1016/S0016-2361(99)00019-8.
[3] Frashad, F., LeBlanc, J.L., Garber, J.D. et al. 1996. Empirical PVT Correlations For Colombian Crude Oils. Presented at the SPE Latin American and Caribbean Petroleum Engineering Conference, Port of Spain, Trinidad and Tobago, 23–26 April. SPE-36105-MS. http://dx.doi.org/10.2118/36105-MS.
[4] Lasater, J.A. 1958. Bubble Point Pressure Correlations. J Pet Technol 10 (5): 65–67. SPE-957-G. http://dx.doi.org/10.2118/957-G.
STOMP User Guide Home
- Simulation Title Card
- Solution Control Card
- Grid Card
- Inactive Nodes Card
- Rock/Soil Zonation Card
- Mechanical Properties Card
- Hydraulic Properties Card
- Saturation Function Card
- 3 Phase Relative Permeability Card
- Salt Transport Card
- Black Oil Properties Card
- Solute/Fluid Interaction Card
- Solute/Porous Media Interaction Card
- Initial Conditions Card
- Boundary ConditionsCard
- SourceCard
- Coupled Well Card
- Output Control Card
- Surface Flux Card